Summary: Metrics are a sensitive aspect to deal with, yet vital. With Agile metrics, you can gauge value addition after incorporating the Agile framework into organizational project management. These metrics are concerned about ‘impact’- what effect did the Agile systems have on the overall productivity, quality of work, and goal accomplishment by various teams. Organizations get a push to move away from micro levels of task management to the macro assessment of real productivity. Read on to understand the top 7 metrics that help unlock the power of Agile development.
Agile software development has seen tremendous growth and adoption in the past two years, jumping from 37% adoption in software development teams in 2020 to 86% in 2021. Agile software development has been particularly suited to the needs of hybrid and remote teams and the need to respond more quickly to changes in the business and economic environments.93% of businesses that adopted an Agile model before COVID-19 outperformed units that had not.
Agile software development/product delivery is focused on continuously incorporating feedback to ensure the product is aligned with the desired business outcome. To avoid common pitfalls in Agile, look at your feedback loop – the process of testing, reviewing, and planning in Agile. How do you know if your Agile team is working toward the business goals? With Agile metrics.
What are Agile Metrics?
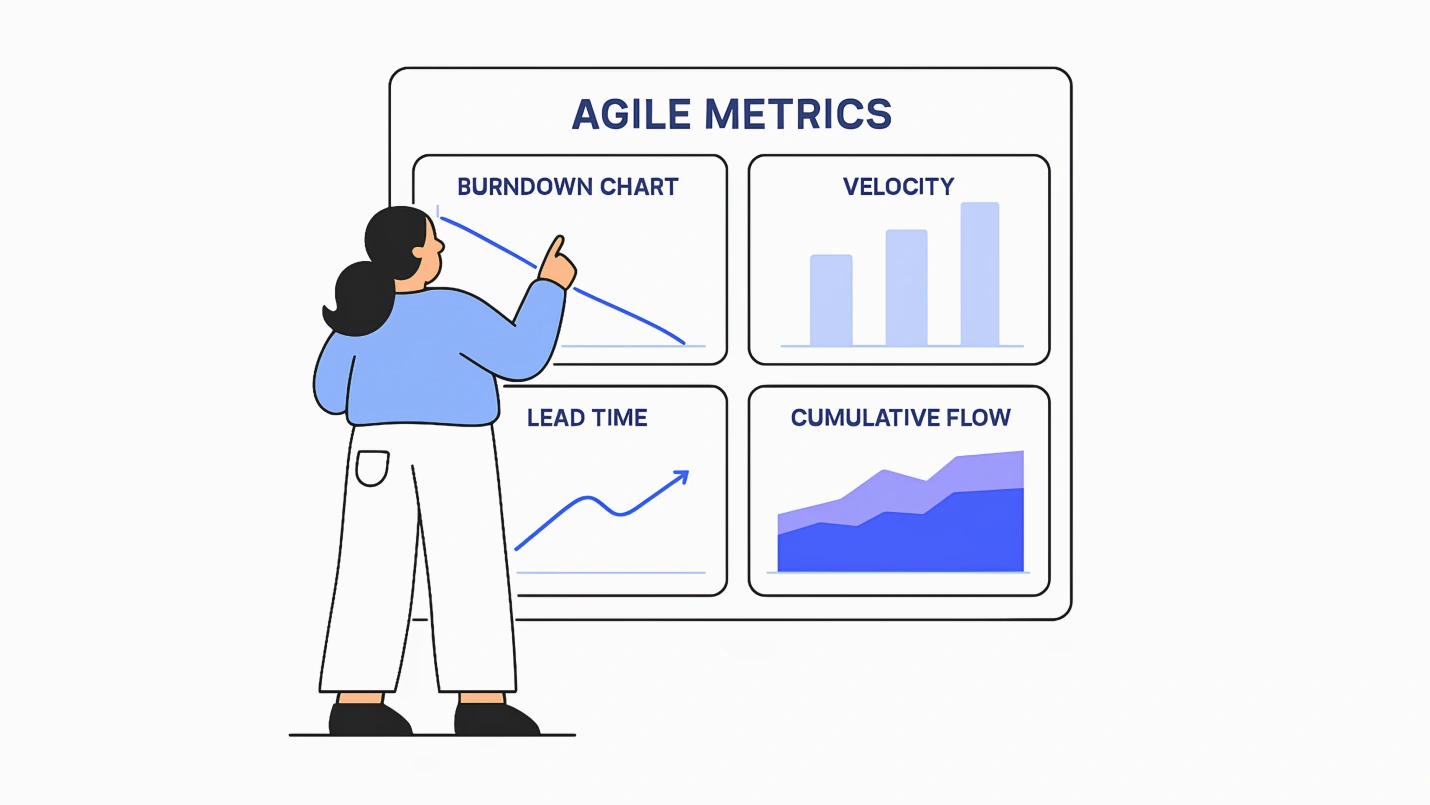
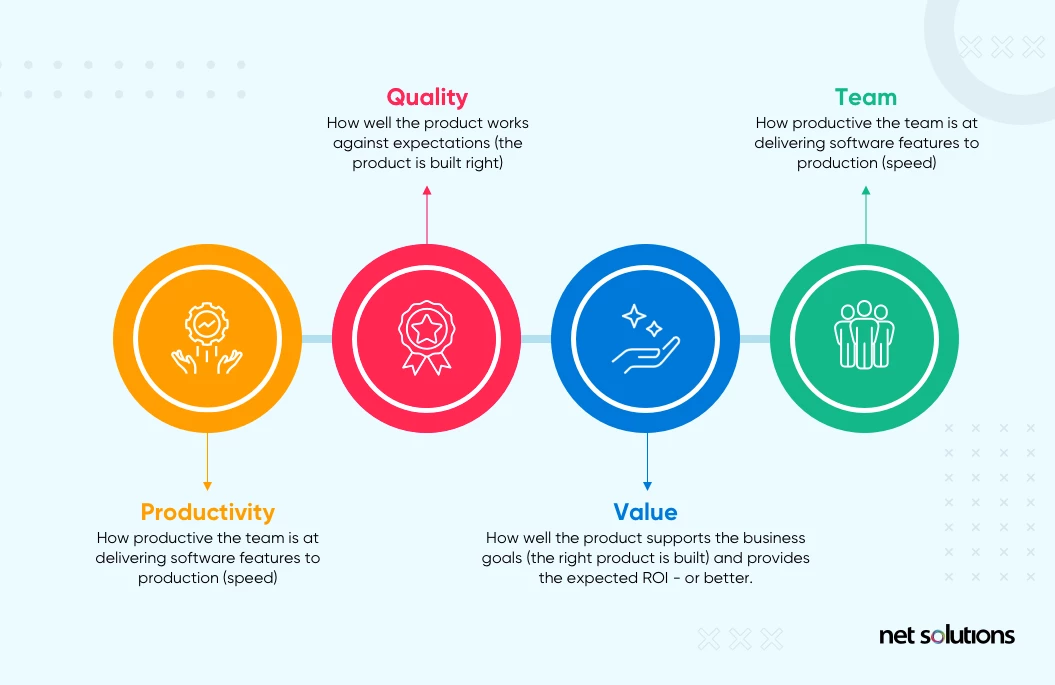
Agile metrics are standard to help measure and monitor Agile performance – how quickly and effectively the team is at achieving development goals. Agile metrics, or Agile KPIs (key performance indicators), typically measure four key areas of software development and its outcomes:
Why Are Agile Metrics Important?
Agile metrics provide essential feedback into the development process – which is the point of Agile, lest we forget! These metrics provide continuous feedback to ensure that the project’s vision remains top-of-mind that that development remains as efficient as possible.
Agile metrics can help with the planning, evaluation, and improvement of Agile processes, including:
- Identifying bottlenecks
- Managing product backlog refinement
- Managing WIP (work in progress)
- Managing and minimizing technical debt
- Helping improve time to market
- Keeping teams and stakeholders aligned on the project and its goals
How to Use 7 Key Agile Metrics to Evaluate Team Performance
What are different Agile metrics and how do they help you measure team performance? This section outlines the 7 top Agile metrics to provide the most simple, easy-to-understand and insightful feedback on the Agile product development process.
1. Agile Metric: Velocity
Velocity measures the total work effort associated with user stories completed during a sprint or release. Velocity helps teams measure their productivity and is often tracked and visible throughout the Sprint to all team members.
Velocity is an important measure of how efficient each sprint was (measuring forecasted effort against actual effort) and is essential when estimating future sprints. With this information in hand, teams can better assess the time it would take to complete a project.
How to Measure Velocity?
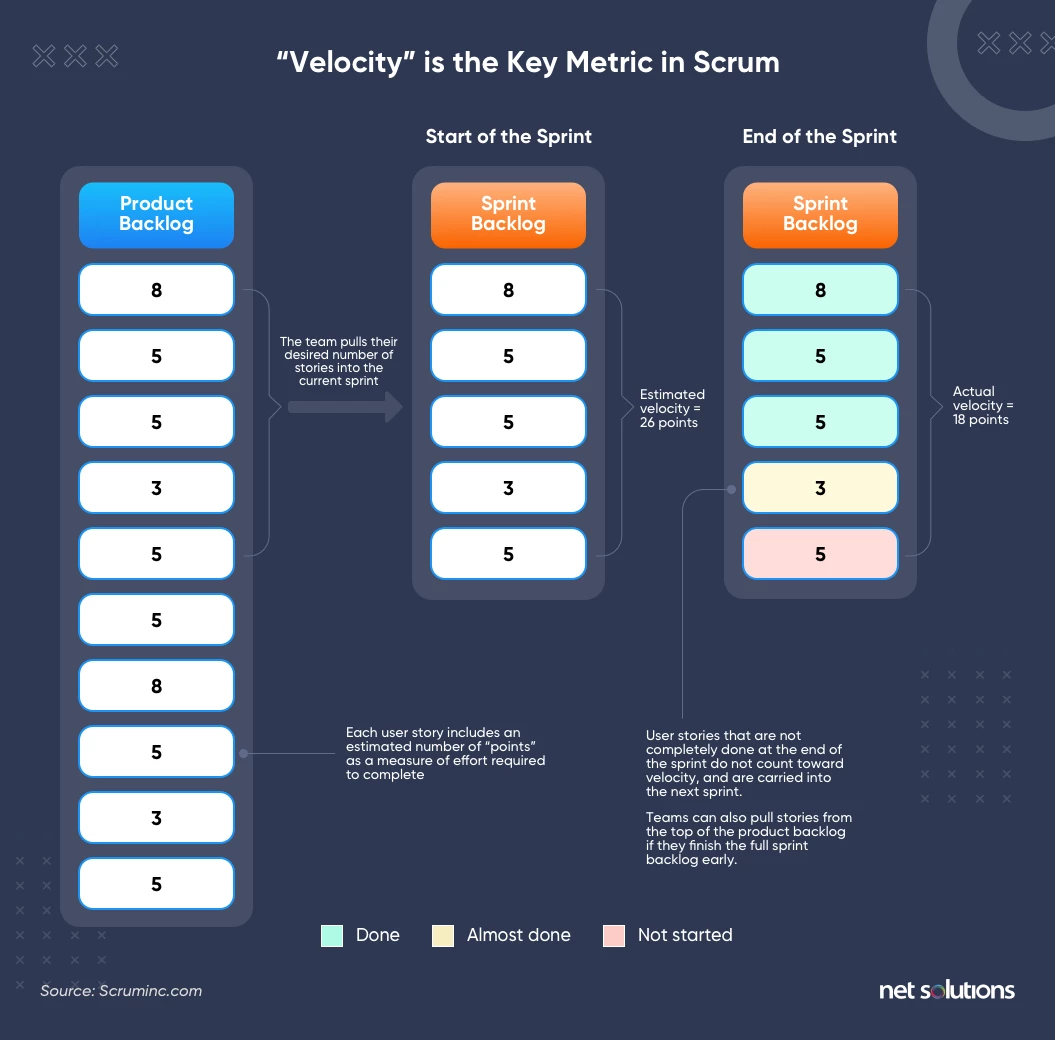
Each Sprint comprises one or more user stories, with each user story assigned an effort value measured by “points.” These stories measure the overall effort to implement each piece of work: focusing on complexity, amount of work, risk, or uncertainty rather than units of time.
When calculating velocity, teams will assign total story points for each completed user story with zero points for each incomplete or partially completed story. Any partially completed user story would roll over into the next Sprint.
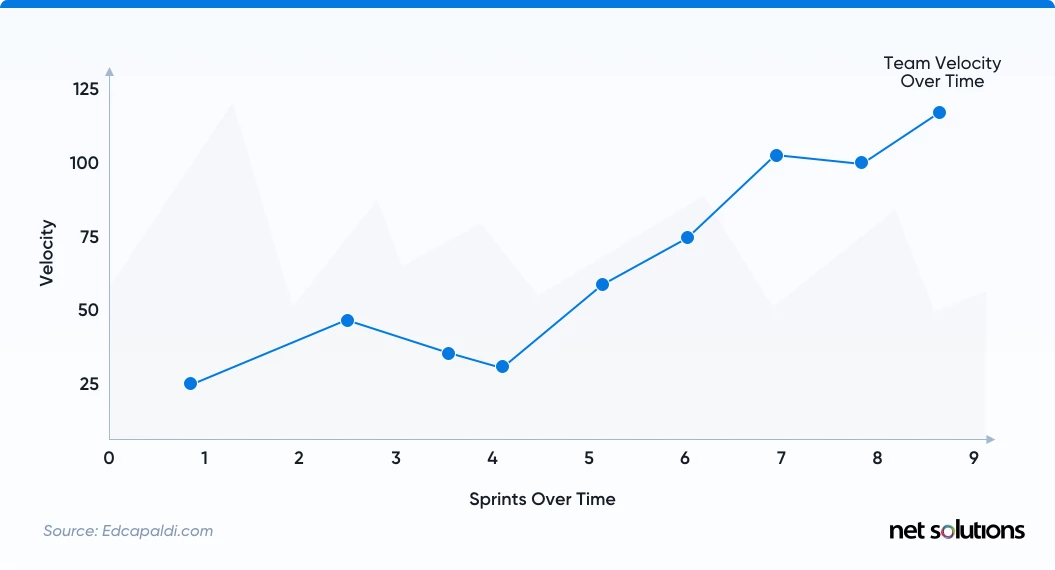
The goal with velocity is to improve Sprint estimating, inform release planning, and measure any process improvements that are being implemented. It should be noted that a well-functioning team will also strengthen its velocity over time:
2. Agile Metric: Team Satisfaction Score
How people feel about their work environment, processes, team dynamics, leadership effectiveness, or the work itself impacts how productive that team will be – both individually and collaboratively. As a collective measure of team morale, the team satisfaction score is an empirical measurement to compare against industry benchmarks or internally between teams and can also be an important early indicator that a team may need attention.
How to Measure Team Satisfaction Score?
There are many ways to gather feedback on team satisfaction, tracked to each team member or gathered anonymously. Some of the more popular approaches include:
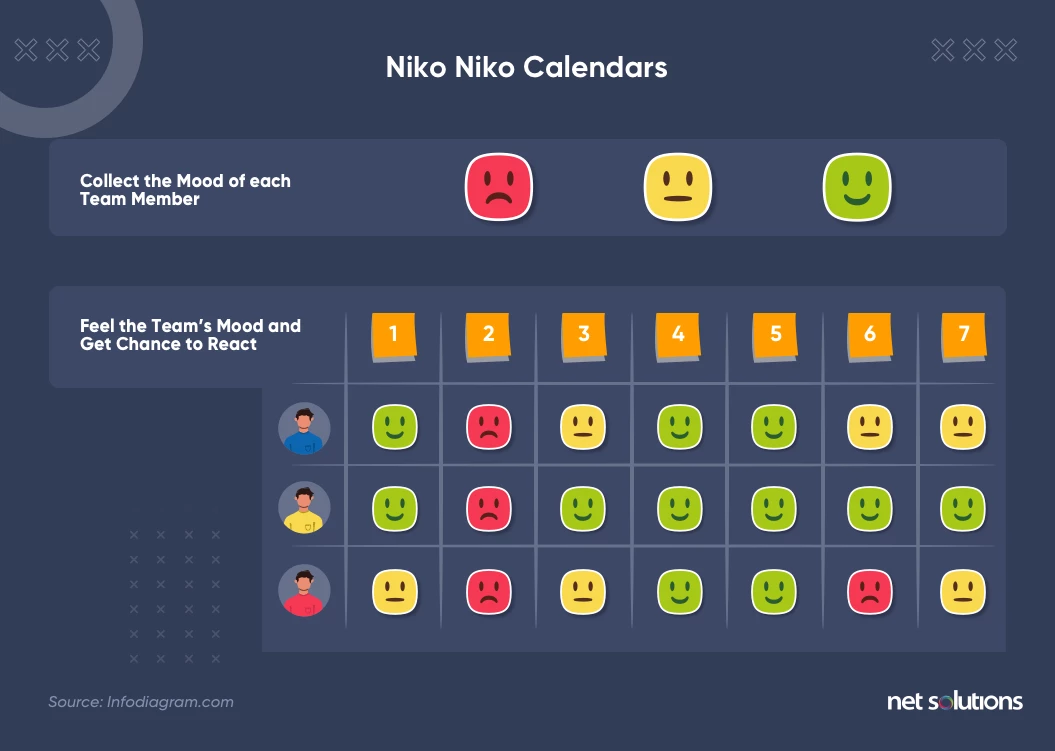
- Niko-Niko Calendars: To track the mood of the team daily.
- Morale meters: Tools such as TeamMetrics or Mentimeter help gather and benchmark team morale across several core factors.
- 1-to-5 ratings: As part of the daily scrum or throughout the day, happiness ratings are ideally supported by an open-ended question about what is working or not working.
The primary risk of team satisfaction surveys is the tendency to self-censor, as individuals may not want to be seen as “whining” or may wish to downplay how factors outside the workplace are impacting work performance.
3. Agile Metric: Lead Time
Lead time is a measurement of the total time it takes to complete a user story: from the time it enters the product backlog until it is completed (in a Sprint) and released. It is a concept borrowed from manufacturing, helping to measure the time it takes to begin creating value (the speed of the value chain).
Lead time is an important measurement of how well a team manages the product backlog as well as how it manages interruptions to work (known as “wait time”) which can happen if questions arise or the next steps cannot be taken for some reason (e.g., waiting for a test environment). In essence, lead time measures how effective your Agile team is at identifying and removing obstacles in the development process.
How to Measure Lead Time?
Lead time can be objectively measured in time units – from the moment a user story is created to the time it is completed and in production. However, depending on the Agile framework being followed, lead time can be further broken down into two pieces (per Kanban):
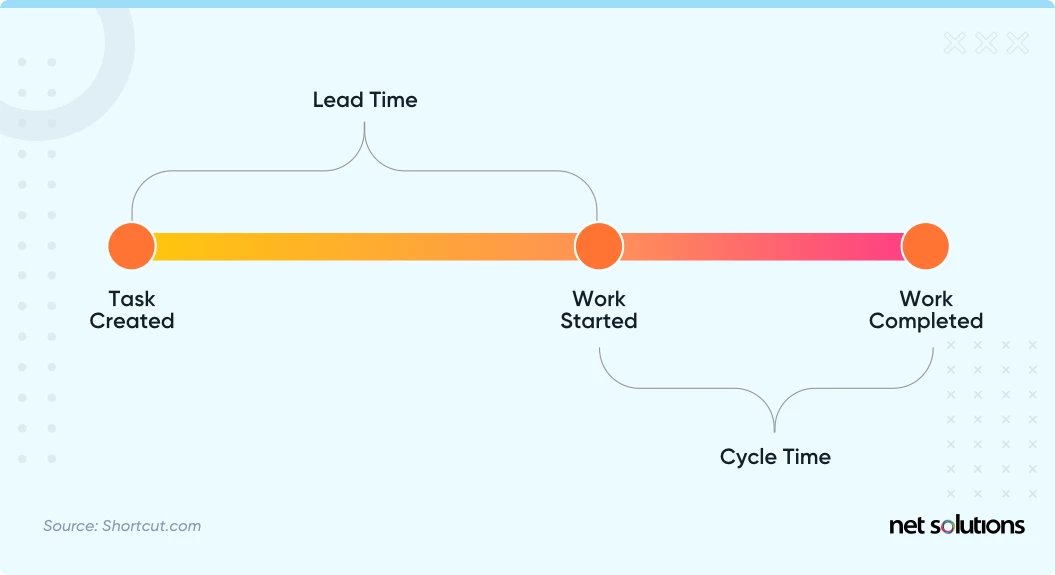
- Cycle time / System lead time: A measurement of how long it takes to complete a user story once work has begun
- Lead time / Customer lead time: The standard understanding of lead time, which includes the product owner’s management of the product backlog and the refinement of the user story as well as any steps needed to deploy the completed user story to production
Lead time comprises a total unit of time, from request/user story creation to when the user story goes to production. However, optimization also includes a consideration of cycle time – the time it takes from when work starts to when it is completed.
4. Agile Metrics: Burndown and Burnup
Burndown and burnup charts are two types of Agile metrics that track the progress of projects. A burndown (burn down) chart measures how much work is remaining on a project: it will always decrease toward zero – the end of the project. A burnup (burn up) chart shows how much work has been completed: it will always increase until it meets the point at which the project scope has been met.

The burndown chart is ideally suited to fixed-scope projects, helping keep track of progress and spot any stalls (problems with velocity) in the project. The burnup chart keeps track of the changing scope of the project, an important element in most projects that experience scope creep.
How to Measure Burndown and Burnup?
Burnup and burndown charts both use story points (see ‘Velocity’ to explain story points) measured against time. In a burndown chart, the measurement begins at the total of story points and continues until the measurement approaches zero. The chart starts at zero in a burndown chart and moves upward toward the most recent estimate of story points (the scope, a measure of story points that changes through time as scope increases or decreases).

We respect your privacy. Your information is safe.
5. Agile Metric: Cumulative Flow Diagram
A cumulative flow diagram (CFD) measures stability in the project workflow, a more sophisticated version of a burnup chart (see above) that measures work in progress, cycle time, and throughput. In the cumulative flow diagram, different stages of the Agile software development process are measured concurrently, helping visualize how many user stories remain in each stage of the development process. The three most important buckets to measure are product backlog, progress, and completion. Other buckets can be tracked (e.g., buffer, review) but are unnecessary for the diagram.
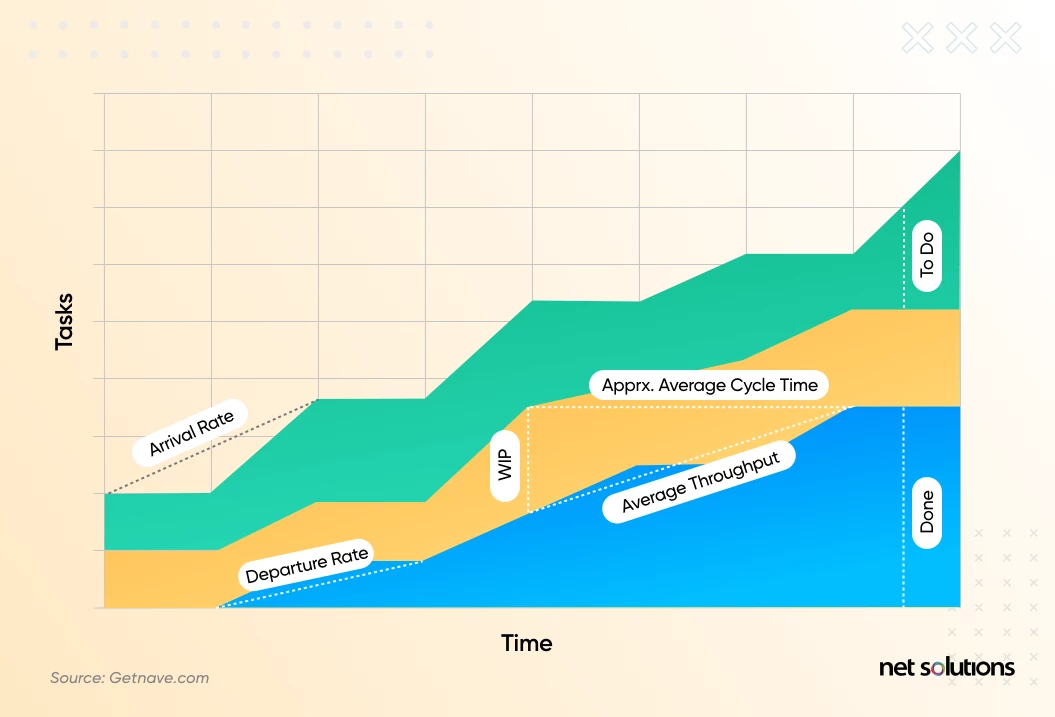
The CFD provides specific measurements on:
- Work in Progress:The amount of work in the state is measured by the distance between the lines of each band. The goal of Agile is to minimize work in progress through continuous iteration.
- Throughput:The average amount of work delivered in a given time. Throughput is impacted by arrival rate (when new tasks appear) and departure rate (completion of tasks), representing the stability of in-process workflow and the volume of work in progress.
- Cycle time:A measurement of the time to complete a certain level of work. An optimal workflow would have in progress and backlog bands of approximately the same thickness, with any disproportionate increase representing a bottleneck in processes that could cause delays.
How to Create Cumulative Flow Diagrams?
Each band in the CFD is measured along the axes of the number of tasks and time. In the Kanban framework, these tasks are called “Kanban cards,” representing a work item. These charts can be created using data input into Excel or Kanban or issue tracking software such as Jira.
6. Agile Metric: Defect Escape Rate
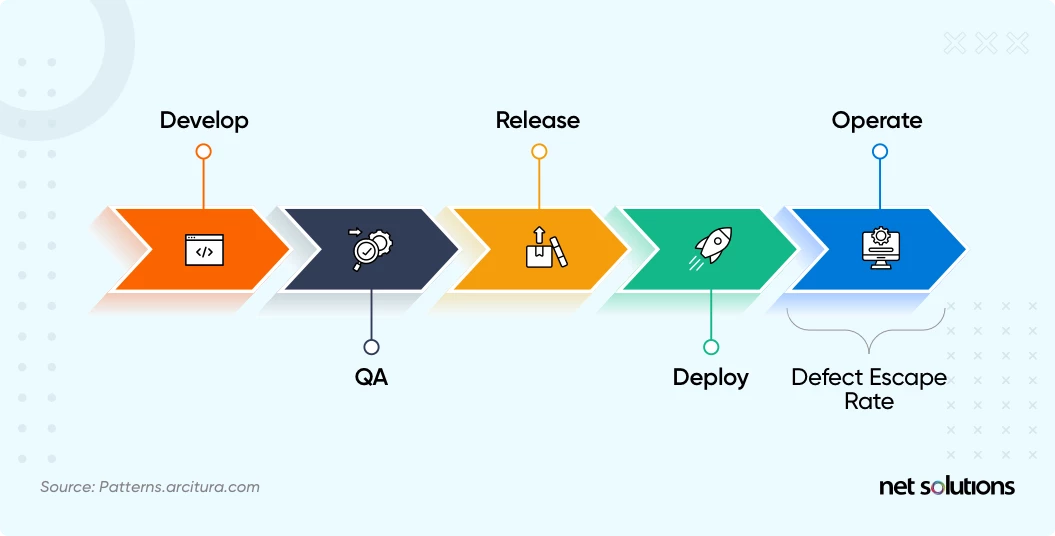
Escaped defects refer to issues, defects, or bugs discovered after the development is complete. These issues (user experience, performance, application errors, or others) are found in production, either during regression or acceptance testing, quality assurance (QA) testing or by users themselves. Defects found in production increase the number of maintenance releases and impact cost and can negatively impact user experience (UX), so it is an important metric.
The defect escape rate is a measurement of the quality of the product – a lower defect escape rate implies a product of a higher quality. When the defect escape rate is high or on the rise, this could point to problems in the testing and is a clear sign that you should slow down and work on those processes: change out automated testing tools, consider if there are missing test cases, consider other revisions to testing processes.
How to Calculate Defect Escape Rate?
To calculate and track the defect escape rate, all you need to do is tag when the defect is found, e.g., QA, production, etc. With this level of detail, you can run a report that calculates a ratio of defects in operation to the total number of defects (pre and post-deployment).
7. Agile Metric: Test Automation Coverage Rate
The test coverage rate measures the amount of testing being performed, helping to determine if the test cases cover the code (are there uncovered areas?). A high test coverage rate means that our testing provides excellent coverage, leading to fewer defects (ideally reducing the above defect escape rate). The test automation coverage rate is an important measure of risk.
Further, the test automation coverage rate helps determine how much of the codebase is covered by automation to help determine if you are reaching your goals for test automation.
How to Measure Test Coverage
The easiest way to measure test coverage is to divide the total range (the entire code base or requirements) by the automation coverage.
Frequently Asked Questions
As many of these metrics help inform forecasting, the product owner is responsible for putting together the metrics, though some may involve the daily assessments completed by a scrum master.
The point of Agile metrics is to optimize the delivery of the product, so the choice in Agile metrics comes down to how experienced the team is, the goals or length of the project, and any problem areas that have come up in the past. If the Agile team works well together, metrics may focus more on testing and quality. In contrast, a new team may benefit more from velocity or lead time metrics to understand performance baselines better.