Data is the inevitable force that continues to grow every single day — about 2.5 quintillion bytes of data is created every day. With everyone going digital, this data is expected to reach 149 zettabytes by 2024. Now if the data is growing, the complexity to extract meaningful insights from it will apparently increase exponentially. So, how do organizations take advantage of data and move ahead in the highly competitive business landscape?
Data analytics is the solution that will help trigger data-driven and data-informed decision-making. In fact, leaders that take charge and invest in data analytics are more likely to generate leads and conversions, and, in turn, revenue.
53 percent of CEOs consider themselves the primary leader of their company’s analytics agenda. — McKinsey
So, how to get started and leverage data to the best of your capabilities?
In this write-up, we explore data analytics in detail to help you conduct better customer and market research. Here is what we will cover:

What is Data Analytics?
Data analytics help in collecting, analyzing, cleaning, and extracting meaningful information from the abundance of available data. A data analytics software aids in the process to enable fast, data-driven, and data-informed decision making.
With data analytics, finding a needle in a haystack does not seem challenging after all.
Accelerating data analytics efforts will help problem-solving, decision-making, minimizing risk, and predictive analysis. Data analytics services are a powerful tool that provides insight into the past and the present while also giving you the power to estimate the future.
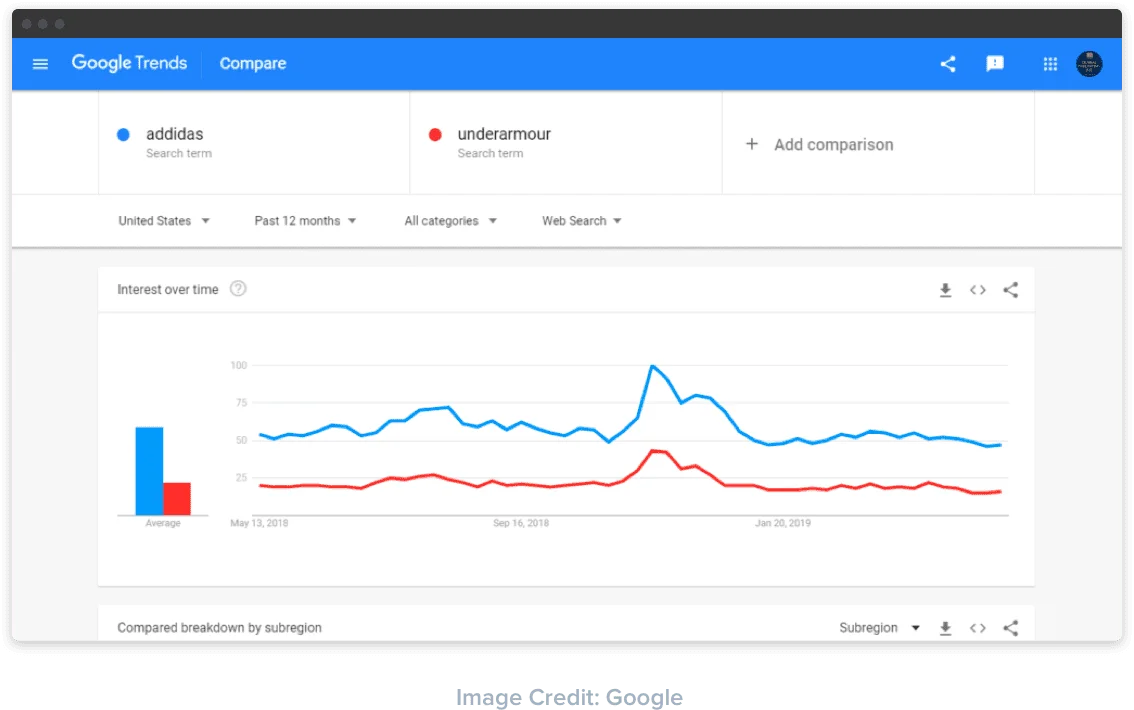
Example of a powerful data analytics tool — Google Analytics — that every other organization uses for understanding how their web pages across the site are performing. Another popular example is that of Google Trends that is leveraged to help figure out the trending search terms.
This single page gives you a glimpse of the popularity of the input term with respect to — time, searches, region, categories, and more.

Where the popularity around data analytics SaaS products is growing, you could step forward and be a leader in the domain.
To enter this lucrative market, the first step is to find the “problem that you want to solve for.”
Difference Between Qualitative and Quantitative Data
Both qualitative and quantitative data are part of data analytics. Any business considering data analytics needs to be aware about the difference between the two.
Here’s what they imply:
-
Qualitative Data
It is mainly descriptive data that highlights the characteristics of type of content under observation. Qualitative data cannot be presented in the form of numbers, graphs, or charts.
For example, qualitative data revolves around how the website looks and what impression it gives.
-
Quantitative Data
This is statistical-oriented analytics that provides insights that are measurable and conclusive. Quantitative data can be presented with the help of data visualization techniques such as charts, graphs, etc.
You can get quantitative data from running surveys, A/B testing, metrics from Google Analytics, etc.
Types of Data Analytics
Data Analytics Process
Here’s a complete process that goes into data analysis:
Define a Problem
What do you need from the data? What type of insights you are looking for. For example, you want to analyze how your customers are perceiving your brand.
Data Collection
Collect the data from multiple available sources. There are two types of sources to collect data, which include:
- Structured data: This is organized data that is easily discoverable, such as name, email address, location, phone number, etc. You can also say that it is custom data collected from internal sources such as CRM software, Google Analytics, social media engagement metrics, ERP systems, etc.
- Unstructured data: This is unorganized data without a predefined format, which makes it challenging to collect, process, and infer. You can collect this data from external sources such as audio and video files, social media APIs, globally available data, etc.
95 percent of businesses need to manage unstructured data.— Forbes
Data Cleaning
Your data analytics team will help you clean the data, i.e., remove redundancies, inaccuracies, and invaluable from the collected data. This is the most time-consuming and crucial task of the entire process.
Data Analytics
Data analytics is implemented using data mining, business intelligence, or Data Visualization Tools. This step helps infer meaningful and actionable insights.
Make Decisions
You have the data and meaningful insights. Now it is time to make data-driven and data-informed decisions. The business drivers across the organization will brainstorm the way forward.
Data Analytics: Tools and Techniques
Data Mining
Data mining is all about accessing and analyzing the databases
for knowledge discovery. The data mining tools help analyze large datasets to uncover hidden patterns such
as trends, statistics, and other data that is otherwise invisible.Effective data mining helps in:
- Organizing the distributed data into one place
- Eliminating redundancies across data sets
- Sorting through relevant data
- Making data-informed decision
Business Intelligence
Key to faster and informed decision making
This technology helps analyze historical and current data
related to business information. BI also helps run predictive analysis that then helps drive a business
towards growth.The global business intelligence market is expected to grow to $29.48
billion by 2022, with a CAGR of 11.1%.— ReutersThe strategies used to implement successful business
intelligence include:- Set Objectives: What would you like to measure? Setting objectives means that you need
to be clear on the key performance indicators you would like to measure and monitor. - Find the Right Business Intelligence Software: There are many cloud-based solutions
available in the market. Choosing the right one that aligns with your business and functional
requirements should be a priority. - Gather and Clean Data: All the data from sales, marketing, and other sources needs to
be gathered and data cleaning needs to be implemented to prepare it for effective business intelligence.

How a team of 3 helped an Automobile E-commerce to build a sales & inventory
strategy using Power BI in just 60 days?- Set Objectives: What would you like to measure? Setting objectives means that you need
Data Visualization
Data visualization helps create visually delightful and easy
to decipher charts and reports, thus enabling fast decision-making. The goal of visualization is to
represent complex data in an understandable format.Good data visualization reduces the users’ cognitive load while
improving their decision-making.
Mario Maruffi
Experience Design, ConsultantCommon types of data visualization include — charts, graphs,
videos, images, funnels, etc.The data visualization process is a five-step process, which
includes:- Data Collection: Gather data from all the available sources
- Running data analytics: Finding meaningful information by parsing through the available
data. - Visualize: Choose a data visualization software and the type of data visualization you
need (graphs, pie charts, images, etc.) - Create a Report: Focus on creating a report around the findings and visualizations
available. The content should align with the visualizations to offer meaningful insights. - Share: The final step is to share the report across the organization or your users (for
whatever audience you are creating the report)
Benefits of Data Analytics
Some of the benefits of following data analytics practices include:
- Enables faster and effective decision making
- Helps forecast, plan, budget, and innovate in a strategic manner
- Provides a competitive edge
- Improve conversion rate optimization
Data Analytics Best Practices
Here are some best practices to follow when creating a product with
data-analytics capabilities:
Identify a Pain Point
What is the problem that you are solving for?
Before you hire a data analytics team, you need to know why
you need a data analytics software. As it is your business, you will have a better understanding of what
data you need to analyze and what is the objective of doing so.For example, a CXO does not have time for going through all
the organizational driven data. Data analytics can help them gain access to the right information at the
right time.
How we Designed a Data Monitoring Dashboard for Quality-conscious CXOs
Hire a Team of Experts
The next step is to hire a team for data analytics, design,
and product development. Here’s why:- Data Analytics
The analytics team will help collect, clean, organize data from
across sources. - Design team
The design team will help create a dashboard design while considering the best data
visualization practices. - Product development
The analytics team will help collect, clean, organize
data from across sources. - Design team
The development team will create an MVP and then
strategically move towards adding/updating features iteratively and incrementally based on feedback.
- Data Analytics
Introduce the Data Analytics Software in the Organization/Market
Host your data analytics software on the cloud and make it
available for everyone. If your tool is for internal usage, run training sessions for your workforce to
enhance its understandability. Similarly, if you want to turn it into your business model — run marketing
campaigns to spread awareness around the problem it solves.Keep Updating
Follow a product mindset over project mindset and keep
updating the software based on new market research and data analytics trends.
Top Data Analytics Trends
The top data analytics trends to follow include:
- Clean and organized data structures
- Relying on artificial intelligence (AI) for running advanced analytics
- Create simplified dashboards that follow trending design practices
- Increase in demand for real-time analytics
- The emergence of embedded analytics
- The rise in demand for machine-learning
- Predictive analytics will take a front seat
- Cloud adoption of analytics solutions
Conclusion
If data is like an iceberg in the ocean — you need to run analytics for the tip of the iceberg as well as what lies at the bottom. Effective data analytics helps in discovering everything about your business and your customers and making informed decisions in turn.
This comprehensive blog covers everything that you should know about data analytics and its relevance for your business. If done right, you could find your way ahead in the leaders vs laggards race.


