
Client
Four Four Two
Industry
Media, Publishing & Entertainment
Features
Live Sports Scores
Real-Time Event Alerts
Animation & Video Export
Opta Integration
Data Analysis
Technology Stack
The United Kingdom is known worldwide for its passionate sports fans, and Haymarket Consumer Media had been a resource for sporting news for more than 60 years. Among its many brands was FourFourTwo, a revered magazine for U.K. football fans who want to read up on matches, teams, and players throughout Europe.
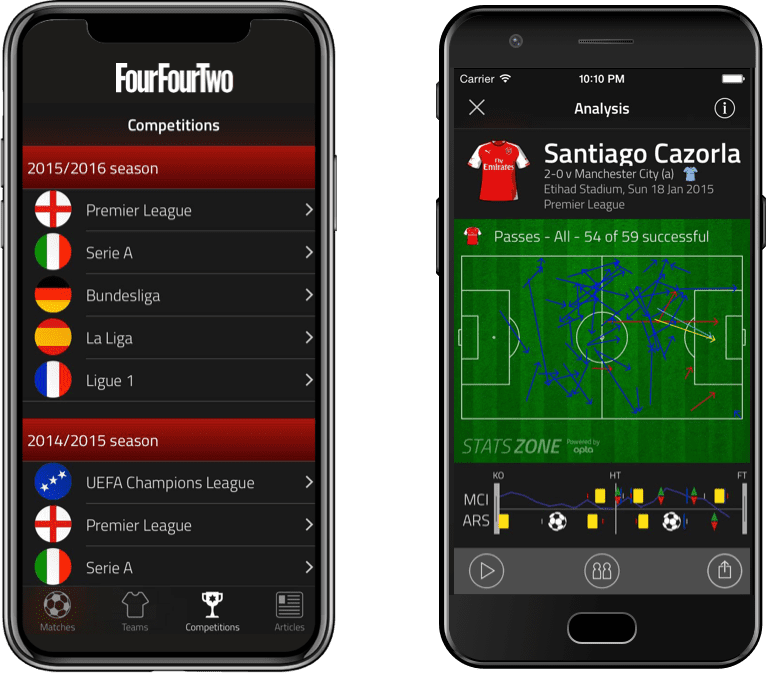
As the internet grew and media outlets branched into online venues, the company entered the digital space. Part of that endeavor led to an extremely popular iPhone app called Stats Zone, which imported and curated real-time football data from a sports data feed called Opta, aggregating data from matches within the following leagues:
This first-of-its-kind app allowed fans to do things like:
Given the success of the iOS (iPhone) app, Haymarket knew it was time to develop a version for Android users. Since the development team was exclusively focused on iOS, they decided to seek outside help for the Android app. That’s when they turned to Net Solutions to build an Android version from the ground up.
Fully aware that they had to provide the same exceptional user experience to their Android users, Haymarket turned to Net Solutions.
Since the iOS developers had created a true iOS app, with code and components that worked exclusively on the iOS platform, the Android development team would need to build everything from the ground up. At the same time, they had to replicate the iOS app in every respect, otherwise the Stats Zone brand would suffer.
Impressed by Net Solution’s app-building credentials, along with their curiosity and willingness to truly understand the product, Haymarket decided to trust this team in Chandigarh, India, with their product’s reputation.

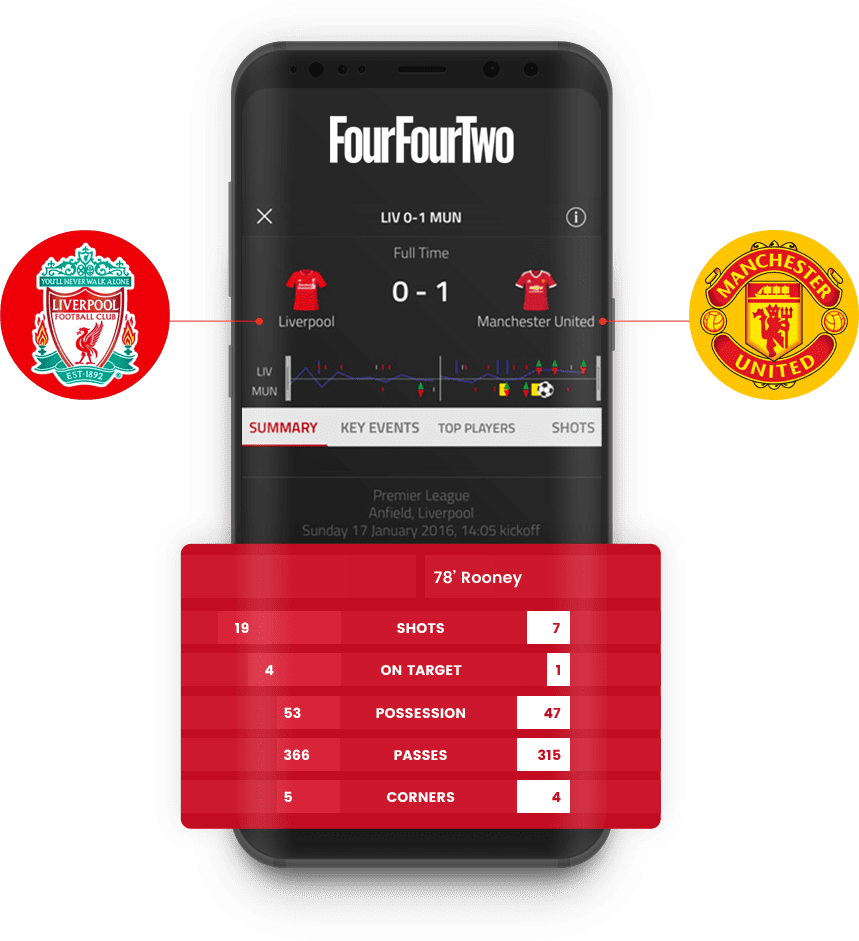
The Stats Zone app featured a live graphical view of a game, where player movements, shots, and other events were displayed on top of a football field layout. This gave fans real-time insights on gameplay. The users could scrub the timeline back-and-forth or even filter information to review only the data that they wanted to see.
Net Solutions faithfully recreated the following key elements of the app.
Live Information and Scores: The app contains a graphical view of live game stats, showing player movements, shots, and other events against the backdrop of a virtual “chalkboard”. Net Solutions made this possible on the Android app by creating a parsing engine that extracted relevant data from the Opta data feed.
Timeline Scrubbing: Users were empowered to scrub the timeline back-and-forth to view second-by-second changes on the field. The team animated gameplay events by taking events received in Opta’s data feed and drawing animations directly on top of the canvas element. This allowed the app to cache the data so timeline scrubbing was smooth and responsive.
Post-match Stats: The app allowed users to filter information based on teams, players, matches, etc., to display only the data they wanted to see.
Key Event Alerts for Specific Games and Specific Teams: Users could set up alerts for events within a specific game (e.g., lineups, goals) as well as key events for their favorite teams.
Social sharing: This feature allowed users to post stats, graphics, and videos to their social media accounts. Net Solutions used open-source video libraries to create the videos of all animations displayed within the app (created in standard format for easy and painless distribution).
Side-by-side Comparisons: Users could compare sports stats for entire teams or individual players side by side. Users could then export the side-by-side data to share it on a variety of social media formats.
The highly anticipated Android app proved extremely popular, racking up downloads, high-ratings, and stellar reviews. It proved to be a close replication of the iOS app, with a very similar look and feel.
With the success of the Android app, Haymarket added new features to the iOS app, and Net Solutions worked in tandem to add those same features in the Android version. One important new feature allowed users to track player influence, highlighting which players had the greatest impact on the outcome of a game.
Haymarket’s relationship with Net Solutions continued for a number of years, with Net Solutions providing the necessary technical expertise to make Stats Zone a popular, highly-rated app.