Executive Summary
If we look at official statistics (published by the government), both US and UK manufacturing and wholesale look highly digital; the problem is that these statistics measure all kinds of electronic ordering together as a single figure, with no split by channel. As a result, we don’t have reliable data on modern digital commerce specifically. In this post, we will give you an overview of the latest data from the US Census Bureau (February 2026 release of the 2023 Annual Integrated Economic Survey), the UK Office for National Statistics eCommerce series, and Eurostat’s EU survey, and why the data is misleading:
- Manufacturing and wholesale report “high eCommerce shares” under the US Census definition.
Reality check: these are sector-specific measures, not one national B2B digital-share figure. - The definition of eCommerce includes EDI, email, and extranets.
Reality check: Large parts of B2B transaction processing went digital before the web, so there is no true picture of what “eCommerce” on the web actually looks like - The last official channel splits are 26 years out of date.
Reality check: In 2000, the US channel split indicated EDI carried 88 percent of merchant wholesalers’ eCommerce sales that year. The UK last reported both channels for 2019, with nearly equal values; the data is old, and neither country has published the split since. - Recent cross-sector data also does not split by channel.
Reality check: The first main Annual Integrated Economic Survey release restored a cross-sector eCommerce view through 2023, but it still does not split orders by channel. - Reality check: The only reliable way to understand B2B commerce levels is to measure your own channel mix. Split revenue by EDI or API, punchout, authenticated portal, open web, email, and phone. Then measure new-customer share, exception rate, and cost to serve for each channel.
There is No Single Official Number for US B2B Digital Commerce
There is no single official percentage for all US B2B commerce. The Census Bureau reports sector-level eCommerce shares, and those shares are much higher in manufacturing and wholesale than in retail because the definition includes EDI, email, and extranets as well as the web. The sector measures rest on different economic activities and denominators: shipment value for manufacturing, sales for wholesale and retail, and revenue for services. Historically, it estimates that 94% of eCommerce is B2B, but…
Reality check: Census cautions that EDI, email, extranet, and web commerce channels differ conceptually and should be combined carefully, yet its estimate relies on simplifying assumptions rather than direct measurement.
Substantial B2B activity also occurs outside manufacturing and merchant wholesale, and some transactions within those sectors would not fit most definitions of independent B2B commerce (e.g., shipments between plants of the same company).
What the Latest US Data Shows, Sector by Sector
The Census Bureau published the first main release of the Annual Integrated Economic Survey, which replaced seven separate annual business surveys starting with the 2023 survey year. Its data products include a cross-sector eCommerce table for employer firms. Its data products include a cross-sector eCommerce table for employer firms. Although it publishes all the data together for the first time, the sector measures underneath do not match.
Census eCommerce share by sector, 2023, one table, one year.
shipments, 2023
manufacturers' sales branches
and offices, eCommerce share of sales, 2023
Without consolidating on a consistent definition of eCommerce, the data cannot be directly compared, yet it is being compared.
The last E-Stats report, covering 2019, put eCommerce at 68% of manufacturing shipments, 33% of merchant wholesale sales (including manufacturers’ sales branches), and 11% of retail sales. This ranking (manufacturing ahead of wholesale ahead of retail) has held for as long as the government has measured it. Against 2019, the 2023 figures show manufacturing essentially flat, wholesale up about two and a half points, and retail up nearly five, the sharpest rise of the three. The order remains stable, but what the report does not explain is why manufacturing and wholesale sit so far ahead of retail. The answer circles back to what the surveys count as eCommerce.
source: US Census Bureau, 2019 E-Stats release, August 2021.
Why Manufacturing and Wholesale Look More Digital than Retail
The Census counts a transaction as eCommerce when the order is placed, or the price and terms are negotiated, over the internet, an extranet, an Electronic Data Interchange (EDI) network, electronic mail, or another comparable online system. Payment does not have to be made online. Nothing about it has to touch a website.
Here is where the conflation happens. EDI is a standardized method through which large trading partners exchange purchase orders, invoices, and shipping notices in a machine-to-machine format, a process used for decades. When a vehicle assembler’s ERP sends an X12 850 purchase order to a brake supplier’s EDI gateway, that shipment is counted as “eCommerce” in the federal statistics. Yet it’s not eCommerce; it’s automation (or electronically transacted sales, if you prefer). As a result of this misdefinition of eCommerce, transportation equipment led all manufacturing subsectors at 80.7% of shipments in the 2023 data. In most cases, this figure represents EDI sales/automation: sales where nobody browsed a page and no product image was rendered.
A company can report a high digital share while new-customer discovery and self-service ordering remain weak. In that case, the number is measuring transaction automation, not digital-commerce maturity.
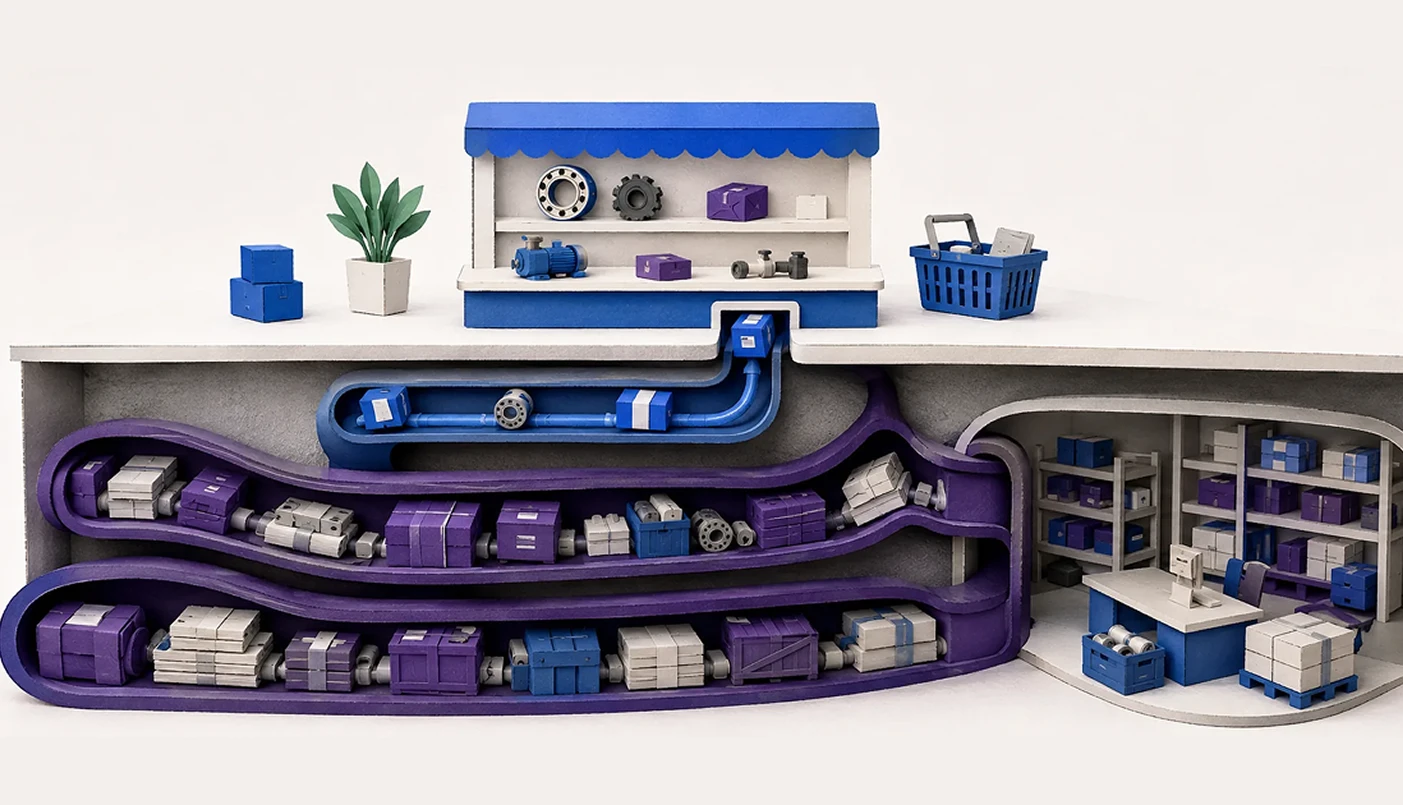
That is the distinction the official statistics cannot make for you. The commercially relevant line does not run between digital and nondigital. It runs between electronically transacted revenue and discoverable, self-service digital commerce. The Census definition spans both, but the published total does not show how much sits in each. Setting each ordering channel side by side shows exactly where the data falls short of representing open, self-service commerce.
What Census Counts that Leaders Would Not
If we lay the ordering channels against what each one proves, the definitional gap becomes a working diagnostic. Every row below counts as Census “eCommerce” except phone orders, although they differ in what they prove about discovery, self-service, and automation.
What Census counts as eCommerce versus what leaders mean by digital commerce.
| Channel | Counts as Census eCommerce | Supports open discovery | Supports self-service evaluation | Requires an established relationship | Suitable for agent access |
|---|---|---|---|---|---|
| EDI | Yes | No | No | Yes | With integration |
| Punchout or API | Yes | No | Within the buyer's system | Yes | With integration |
| Authenticated portal | Yes | No | After authentication | Yes | After authentication |
| Public web store | Yes | Yes | Yes | No | Yes, if data is structured |
| Email order | Yes | No | No | Usually | No |
| Phone order | No | No | No | Usually | No |
The table shows which channels can carry open discovery and which cannot.
The next question is how much B2B revenue actually runs on each channel.
National Data Does Not Split The EDI-Versus-Web Sales
The Census Bureau does not publish a current national EDI-versus-web split, and we found no authoritative US public replacement. The last official Census breakout was published for 2000. In that year, EDI carried $188 billion of merchant wholesalers’ eCommerce sales (88% of the total). Manufacturing plants that primarily used EDI to accept online orders accounted for roughly two-thirds of eCommerce shipments among responding plants, while plants primarily using internet networks accounted for 5%.
In the UK, the Office for National Statistics ran an eCommerce survey on the same definition, splitting sales between EDI and websites. Its last release covers 2019: £668.9 billion in eCommerce sales from UK non-financial businesses with 10 or more employees. The published point estimates were almost identical: £334.0 billion through EDI and £334.9 billion through websites, reached from very different directions, with website sales having more than trebled since 2009 while EDI sales grew by about a quarter. A later Digital Economy Survey, published in April 2023, gave website sales for 2021 but no EDI estimate. ONS has since paused that survey to rebuild it over data-quality concerns, so the channel split has never been resumed.
Obviously, today’s channel sales mix will differ from the antiquated data we have from official sources. Web stores, portals, punchout catalogs and marketplaces have grown since 2000. EDI remains widely used, but the national division between those channels is no longer published in the US or the UK. The only estimate we have of the EDI-vs-web split comes from Eurostat’s 2024 data, which shows EU enterprises taking more turnover through EDI-type sales (11%) than through websites and apps (8%), with the EDI share highest in manufacturing (read more about this here).
Because national statistics are unreliable, your own channel mix is the only measurement you can rely on.
What B2B Leaders Should Measure Internally
The number the government does not produce is the one you can. Split your own revenue by ordering channel: EDI or API, punchout, authenticated portal, open web, email, and phone. Then measure three things per channel: new-customer share, exception rate, and cost to serve. Automated repeat trade proves known counterparties can transact efficiently. An authenticated portal proves existing customers can search, price, and order. So far, every one of these channels assumes the buyer already knows you.
Open digital commerce provides the clearest direct evidence that unfamiliar buyers can discover and evaluate you without an existing account or human intermediary. The exception rate tells you how much of your digital revenue still depends on manual interpretation. With the advent of AI, we’re now entering an era of B2B commerce that no longer requires manual (or person-led) interpretation at all.
The B2B platforms that win the next five years will not be the ones with the highest eCommerce share. They will be the ones a stranger, or a stranger’s agent, can read, price, and buy from without picking up the phone.
What Agentic Commerce Means For B2B
EDI proves that B2B companies have automated repeat transactions between known counterparties for decades. Agentic commerce (where autonomous or semi-autonomous AI finds, compares, and/or completes purchases) introduces a new problem: how to support discovery and product understanding before a trading relationship exists.
The EDI Journey
An EDI purchase order usually assumes that both parties already know the product identifier, price structure, and commercial relationship. EDI messages can carry identifiers and descriptions; what the standard was never designed to be is an open discovery and product-understanding layer.
The Agentic Commerce Journey
An AI procurement journey may begin with an open-ended requirement. It needs to find candidate products, compare specifications, resolve compatibility, and determine which supplier can fulfill the request, all before the order ever reaches an API, portal, or EDI workflow. That front end runs on structured, machine-readable product data, which is a different asset from a transaction pipe, and many established B2B businesses have invested in transaction rails for decades and in open, machine-readable discovery for much less time.
AI adoption is now material, particularly among larger firms: the Census Bureau’s Business Trends and Outlook Survey shows overall use holding between 17-20% of US firms from December 2025 to May 2026, and 37% among firms with 250 or more employees. While the data is imperfect (it covers US businesses generally rather than B2B companies specifically and does not directly measure the overlap between AI adoption and EDI operation), it highlights a clear need to serve this new “AI buyer.” Many companies are adding probabilistic, language-driven systems on top of transaction flows designed for known products and established trading relationships, but this completely ignores the needs of agentic commerce.
How Hancocks and Wemoto Turned Electronic Revenue into Self-service Commerce
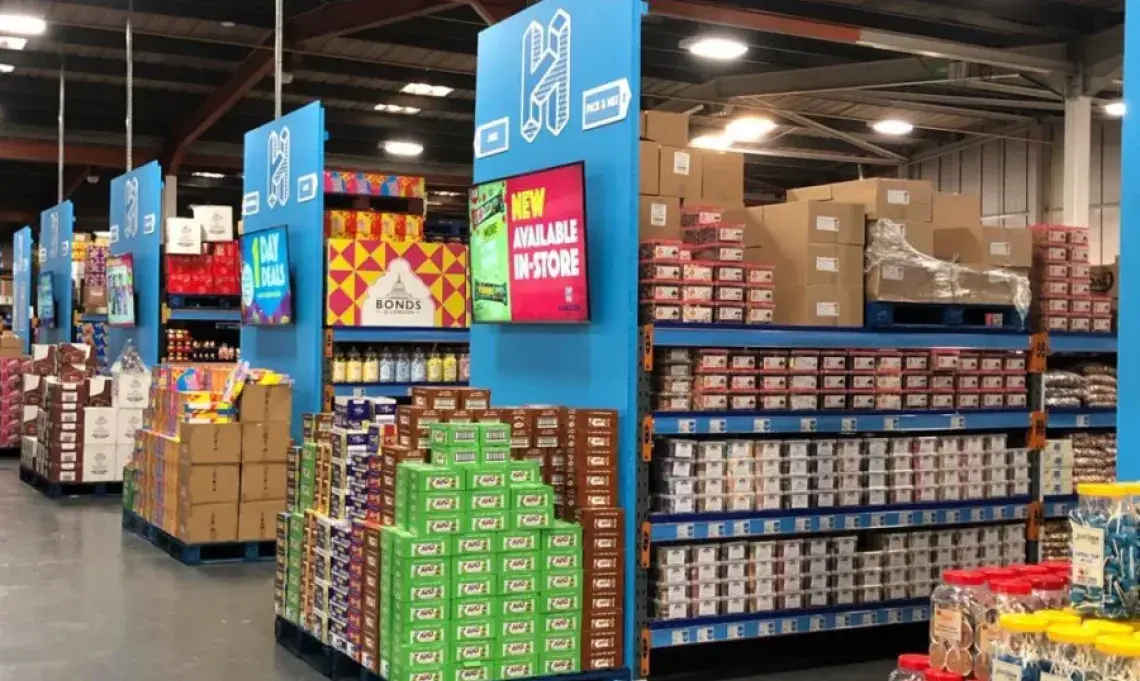
Let’s look at how organizations are transforming their eCommerce sales by better understanding their own channels. Hancocks, a UK bulk confectionery wholesaler, has been trading since 1962. When they came to Net Solutions, they already had substantial digital trading activity, but also significant problems. Their legacy architecture restricted concurrency, content operations, and self-service growth. They knew that any modernization work was not about making the business digital for the first time; it was about turning existing electronic revenue into a scalable, discoverable commerce operation, without pausing live B2B trading while it happened. Modernization efforts included rebuilding its platform on headless Adobe Commerce with Contentful.
For Wemoto, a similar modernization effort helped move eight legacy systems into one multi-tenant platform with a UK trade portal and automated cross-franchise ordering.
FAQs
There is no single official percentage for all US B2B commerce. The Census Bureau reports sector-level eCommerce shares, and those shares are much higher in manufacturing and wholesale than in retail because the definition includes EDI, email, and extranets as well as the web. The sectors use different economic measures, so they do not sum to one national B2B figure.
Yes. Census counts any order where price and terms are negotiated over the internet, an extranet, an EDI network, email, or another online system. Payment does not have to be made online. A purchase order moving through a decades-old EDI connection counts the same as a web checkout.
The Census Bureau does not publish a current national EDI-versus-web split, and we found no authoritative US public replacement. The last official Census breakout, for 2000, put EDI at 88% of merchant wholesalers’ eCommerce sales. The UK’s last reported split, for 2019, showed nearly equal values at roughly £334 billion each way, and the split has not been continued since. The EU still measures the split: Eurostat’s 2024 data shows EDI-type sales carrying more enterprise turnover than web sales.
Yes. In February 2026, the Census Bureau published the first main release of the Annual Integrated Economic Survey, including a cross-sector eCommerce table for employer firms with data through 2023. It does not publish a breakdown of how those electronic orders were placed: EDI, web storefront, portal, punchout, or another channel.
eCommerce share measures how much revenue was ordered or negotiated electronically. Digital-commerce maturity asks a different question: whether customers can discover products, evaluate them, receive account-specific prices, complete orders without manual intervention, and obtain consistent service across channels. A company can score highly on the first measure and poorly on the second.
Which Pipe Does Your Digital
Revenue Run On?
Bring your order-channel data and platform architecture. We will help separate automated repeat trade from discoverable self-service commerce and identify where modernization can reduce cost to serve or open new demand.