
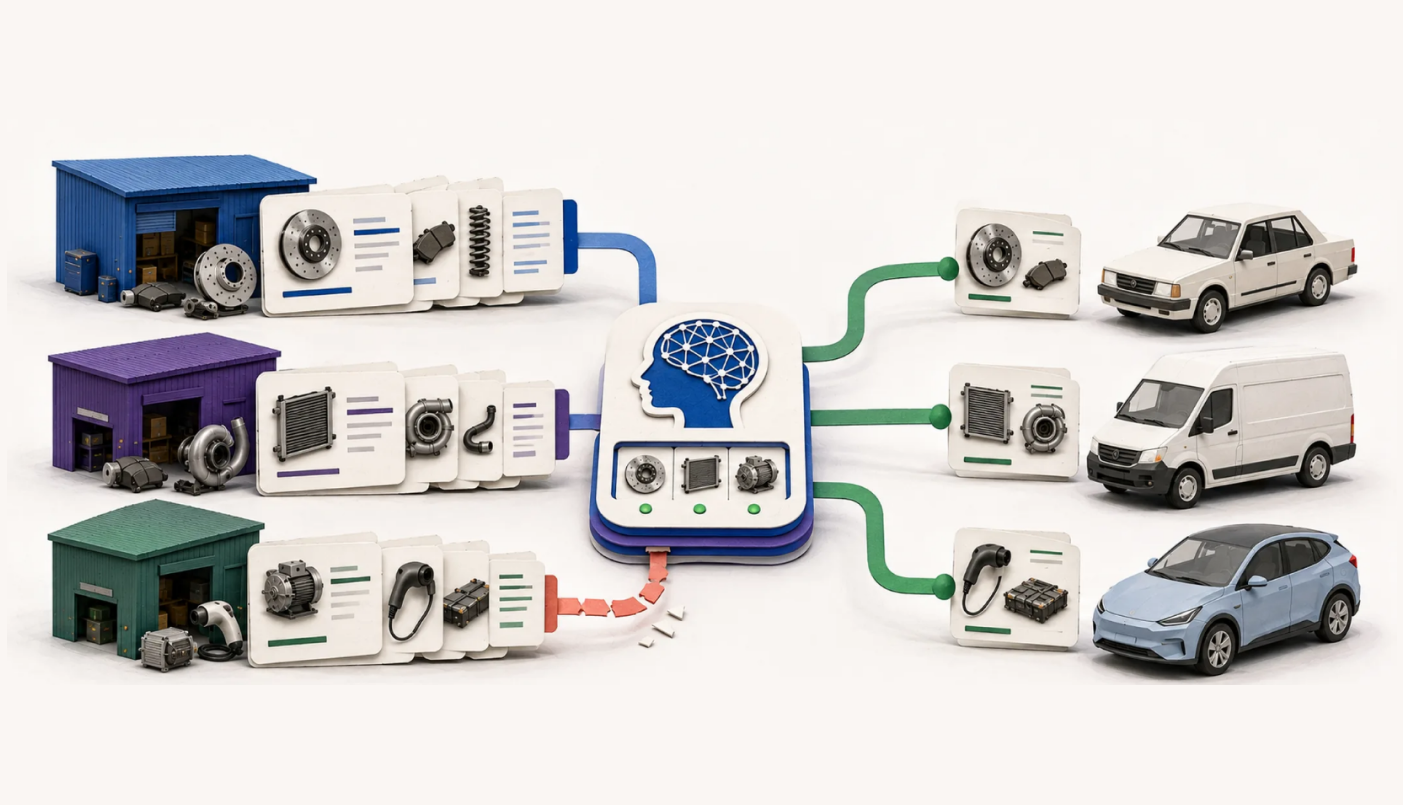
Executive Summary
Structured data has crossed half of crawled pages, but no public dataset directly measures product-record completeness. This page assembles the best proxies and names what each one can and cannot prove.
No public dataset directly measures product-record completeness across the web. The figures below are the best available proxies: the prevalence of structured markup, adoption of product identifiers, domain-level use of Product annotations, selected data-quality studies, and commerce platforms’ enforcement rules. Every figure links its source and names its vintage, and the page is refreshed when new datasets are published.
- 51.25% of examined pages contained some form of structured data in Web Data Commons’ 2024 extraction, up from 5.7% in 2010, with a dip and recovery along the way.
- 60% relative adoption of Product/SKU, up from 21% five years earlier. An adoption measure, not a record-level completeness rate, and SKU is a merchant-specific identifier.
- 3.3 million websites published and product annotations in the 2024 data went up from roughly 594,000 in 2018.
- EDI still outweighs the web where both are measured: EU enterprises took 11.07% of 2024 turnover through EDI-type sales against 8.39% through websites and apps.
- A check to run this week: Compare the initial HTML and rendered DOM (the page as the browser finally assembles it, after scripts run) for one product page, validate its Product markup, and compare the same fields with any merchant feed or catalog API you publish. Any decision-critical field missing from all of those surfaces is unavailable to the systems that depend on them.
What Share of Web Pages Contain Structured Data?
Structured data appeared on 51.25% of the pages examined in Web Data Commons’ 2024 web-scale crawl. Product-specific adoption and completeness remain materially thinner, so the very records a shopping agent needs to act on are the ones least likely to be machine-readable. Web Data Commons is a University of Mannheim research project that has extracted structured data from the Common Crawl every year since 2010, the longest continuous public record of structured data on the web, and its first extraction found structured data on 5.7% of examined pages.
Two limits on that headline, stated up front. The figure describes the pages examined in that crawl, not the whole live web. And it counts markup of any entity type: organizations, articles, breadcrumbs, and people as much as products. The 2024 extraction is the latest published Web Data Commons annual release. The 2025 Web Almanac has since published newer web-scale observations from its July 2025 crawl of 16.2 million websites, using a different methodology and page sample. The Web Almanac’s latest dedicated structured data chapter remains the 2024 edition.
Structured data crossing half of crawled pages means the web has learned to describe itself. Product records are still the thin part, and that gap is where AI commerce succeeds or stalls.”
Lalit Singla, Senior Technical Architect, Net Solutions
How Many Websites Describe Products for Machines?
3.3 million websites published schema.org product annotations in the 2024 Web Data Commons data. Web Data Commons recorded roughly 594,000 such sites in 2018, 2.6 million in 2022, and 2.82 million in 2023, so the population of sites describing products for machines has grown more than fivefold in six years. Growth in who participates, though, is not the same as depth in what each participant publishes.
Websites Publishing Schema.org Product Markup, by Extraction Year.
How Complete Is the Existing Product Markup?
No dataset answers that directly, so start with the closest proxy. Web Data Commons reports that the relative adoption of the schema: Product/sku property rose from 21% to 60% over five years. That is an adoption measure, not a record-level completeness rate, and it is worth being precise about what SKU is: schema.org defines it as a merchant-specific identifier, commonly used to join internal catalog, inventory, and pricing records.
Cross-merchant product matching commonly relies on identifiers such as GTIN (the Global Trade Item Number encoded in a product’s barcode) or brand plus MPN (the Manufacturer Part Number), where those identifiers are available.
Across JSON-LD annotations (the script-based format Google recommends for embedding structured data), generally, the average number of triples (individual encoded facts, such as one product’s name, price, or brand) per annotated page increased from 10 in 2015 to 57 in 2024. That shows richer structured data overall, but it is not a product-record completeness measure, because the series covers annotations of every entity type, not Product pages alone. (Source: Web Data Commons, October 2024 release, property-level adoption and annotation-richness statistics.)
An independent page-level measurement keeps the product picture honest. In HTTP Archive’s 2024 mobile crawl, Product appeared on 1.50% of pages through Microdata (an older format that tags data inside existing HTML) and 0.77% through JSON-LD. These are format-specific page-level rates, not a deduplicated total for all Product markup, since a page can carry both formats. Either way, the direction matches: product-specific markup remains rare relative to navigational and organizational markup, even as structured data overall becomes the norm.
Product Markup By Format, On A 0 To 10 Percent Scale.
Scale on the identifier side makes the shortfall on the attribute side sharper. GS1, the standards body behind the barcode, announced in 2022 that brand owners had uploaded over 200 million GTINs to its Registry Platform, each carrying a small set of foundational attributes for verification. The identifiers exist at industrial scale. The gap this page keeps measuring is everything a machine needs beyond the identifier: the attributes, relationships and fitment that let a system act on a product rather than merely recognize it. Nowhere is that gap wider than in the automotive aftermarket, where a record is not even correct until fitment is resolved; that case is examined below. (Source: GS1 Registry Platform milestone announcement, 2022 vintage; current registry count to be confirmed at publish.)
Is There an Official Record of Schema Adoption?
Since June 2026, schema.org has published monthly usage ranges derived from Google’s web index. The first release, dated May 2026, spans 5,545 entries across 958 types and 4,587 properties, each reported as a domain-count popularity bucket. Two boundaries to respect when quoting it: the counts are buckets rather than an exact verified census, and the lens is Google’s index rather than the whole ecosystem. Used within those limits, it answers a question the annual crawls cannot: between deep measurements, this provides a monthly signal of which terms Google encounters across indexed domains. (Source: schema.org usage statistics documentation and the June 4, 2026 announcement; monthly files on the schema.org GitHub repository, first release dated May 2026.)
How Much of Digital Commerce Still Moves Over Closed Pipes?
Product markup is how machines read products on the open web. Most machine-to-machine commerce never touches the open web. Eurostat’s 2025 survey of ICT usage in enterprises, covering sales made in 2024, found EU enterprises generated 19.49% of total turnover from e-sales.
Split that number, and the older channel wins: 11.07% of turnover came via EDI-type messages, compared with 8.39% via websites and apps. The EDI-type share of turnover was highest in manufacturing, at 17.86%, and in wholesale and retail trade, at 10.51%.
Machine buyers over the last forty years largely automated transactions between known parties; the newer challenge is making products discoverable and understandable before that trading relationship exists. EDI is structured and machine-readable, but it normally operates between parties that already know the product identifier, commercial terms, and each other.
An open-discovery agent may begin without that relationship. It therefore needs public or partner-accessible product data to identify the item and supplier, even when the eventual order flows through an authenticated API, portal, or EDI connection. We took that thread further in a companion analysis of the US figures, where the government stopped publishing the web-versus-EDI split entirely in the early 2000s.
EU Turnover Split Between Web Sales And EDI-Type Sales, 2024.
How Intensively Are AI Platforms Crawling the Web?
AI platforms can consume product information without sending a proportional visit back, so machine retrievability now matters even when the buyer never lands on the page. AI crawling now has its own public measurement. Cloudflare, whose network proxies a large share of global web traffic, publishes crawl-to-refer ratios on its Radar platform: how many pages an AI platform’s crawlers fetch for every visit that platform refers back.
In the launch analysis covering June 19 to 26, 2025, the ratios ranged from roughly 70,900 pages crawled per referral at the top of the distribution down to below one at the bottom, varying by platform and by week. The precise figures move constantly, which is why this page quotes the measure and its source rather than freezing a number that will be wrong by the time you read it; the current 28-day window sits on Radar’s AI Insights pages.
Cloudflare’s ratios show that some AI platforms consume far more pages than they refer visits back to. They do not reveal whether a particular crawl supported training, search, or a user action, and native-app referrals may be undercounted. That narrower reading still matters: for a catalog, machine retrievability is now one component of visibility.
(Source: Cloudflare, crawl-to-refer analysis, July 2025, with live figures on Cloudflare Radar AI Insights. The dated June 2025 example is retained deliberately; the live view is linked rather than frozen into the copy.)
What Does Incomplete Product Data Already Cost?
Product-data inconsistency is already a commercially enforced condition, policed by machines. A mismatch between feed data and the landing page can trigger preemptive item disapproval in Google Merchant Center. In plain terms, mismatched data pulls the product from Google Shopping ads and free product listings, so it stops selling and stops earning on those surfaces until you fix it. Google also offers automatic item updates that may correct some price or availability mismatches before disapproval, and its own documentation notes those updates read the structured data on the landing page. (Sources: Google Merchant Center policy documentation on item issues and preemptive item disapproval and automatic item updates.)
Agent-facing commerce interfaces are arriving. OpenAI’s Agentic Commerce Protocol now supports product discovery through direct merchant feeds, third-party feed providers and catalog integrations. Structured product data is becoming an important route into AI-mediated discovery, while product imagery, merchant-controlled checkout and the rest of the buying experience still matter. (Source: OpenAI Agentic Commerce Protocol merchant documentation, including the product feed specifications.)
Why Automotive Fitment Data Is Harder for Machines to Read
Automotive aftermarket catalogs are among the most application-dependent product datasets in commerce: every fitment-dependent part must be resolved against the relevant vehicle, application and build constraints before an answer to a buyer is even correct, let alone machine-readable. And the demand side is measurable.
At the end of December 2025, the average age of a licensed car in the UK reached 10 years, 14% higher than at the end of December 2020, per the Department for Transport’s vehicle licensing statistics. An aging vehicle parc (the total fleet of vehicles on the road) supports sustained demand for maintenance and replacement parts, which means more fitment-dependent records, published by more sellers, that machines increasingly answer from. (Source: UK Department for Transport, vehicle licensing statistics, United Kingdom: 2025, table VEH1107, with the underlying table on the vehicle licensing data tables page.)
What Each Dataset Actually Measures
The figures above come from datasets with different units and different blind spots, and comparing them as one series is the standard mistake this page exists to avoid. The table is the map.
What Each Of The Five Datasets Can And Cannot Prove.
| Dataset | Unit | What it measures | What it does not measure |
|---|---|---|---|
| Web Data Commons | Pages and domains | Structured-markup adoption in the Common Crawl | Product-record accuracy or completeness |
| Schema.org usage | Domain popularity buckets | Term adoption in Google's index | Exact ecosystem-wide usage |
| HTTP Archive | Pages by markup format | Format-specific implementation rates | Deduplicated Product adoption |
| Eurostat ICT survey | Enterprise turnover shares | Web versus EDI-type sales channels in the EU | Quality of the data in either channel |
| Cloudflare Radar | Requests per referral | AI crawl volume against referred visits | What crawlers extract or retain |
What a Rebuilt Catalog Pipeline Looks Like in Practice: GSF Car Parts
One client result belongs here, kept apart from the public datasets above. When Net Solutions rebuilt GSF Car Parts‘ commerce platform, restructuring the catalog data was the load-bearing work. Product-data imports fell from 16 hours to 17 minutes, materially reducing how long catalog changes took to enter the commerce pipeline. In practical terms, a price or stock change now reaches shoppers the same hour instead of the next day, so the feeds, landing pages, and search indexes an agent reads stay in agreement. That is a freshness and throughput result, not a completeness score. Longer propagation windows increase the risk that feeds, landing pages, search indexes, and operational systems disagree on price or availability.
Method and Update Policy
Every figure on this page links its dataset and names its vintage inline. Public statistics and Net Solutions client results are never combined into a single claim. Figures are reproduced as published by their sources; where a source revises a number, this page follows the revision and notes it. Extrapolations do not appear here; where no current figure exists, the page says so. We review this page whenever Web Data Commons or the Web Almanac publishes a new dataset. Replaced values remain visible so you can inspect changes in methodology and direction. To cite a specific chart, link its anchor; every figure on this page has one.
Frequently Asked Questions
Structured data appeared on 51.25% of the pages examined in Web Data Commons’ October 2024 extraction of the Common Crawl, up from 5.7% in 2010. That measures markup of any entity type, not product data specifically, and it describes the pages examined in that crawl rather than the whole live web.
No public dataset measures product-record completeness directly. The closest proxy: Web Data Commons reports that the relative adoption of the Product/sku property rose from 21% to 60% over five years. That is an adoption measure, not a record-level completeness rate, and SKU is a merchant-specific identifier rather than a universal one.
Yes, at scale. Eurostat’s 2025 survey found EU enterprises took 19.49% of 2024 turnover through e-sales, of which 11.07% came via EDI-type messages and 8.39% via websites and apps. The closed, pairwise pipes still carry more money than the open web, and the EDI share is highest in manufacturing.
AI assistants and shopping agents answer buyers from the data they can parse. A product without structured, identifiable attributes is hard for an agent to retrieve, compare, or purchase, regardless of the product’s quality. Commerce platforms already enforce feed accuracy commercially, and agentic checkout programs make structured product data an important route into AI-mediated discovery.
Public datasets, each linked at its figure with its vintage: Web Data Commons extractions of the Common Crawl, the HTTP Archive Web Almanac, schema.org’s monthly usage statistics, Eurostat’s ICT usage and e-commerce survey, GS1’s registry announcements, Cloudflare Radar, and UK Department for Transport vehicle licensing statistics.
Four Questions Decide Whether AI can Do Business with You
Can AI find you, understand your products, interact with your site, and complete a purchase? We call it DUCT:
Discoverable, Understandable, Capable, Transactable
Our complimentary AI Readiness Assessment scores your business against all four pillars and names the highest-priority gaps to fix first.