


Automotive Aftermarket · Revenue Leakage Assessment
Every aftermarket
parts retailer is losing revenue right now.
Most can't see where.
Slow checkout, failed vehicle lookups, messy catalog data, parts invisible to AI search – leaks that never show up as one obvious problem. We score your live site against all eight, and show you where the money’s going.
FREE No pitch deck. No account manager on the first call.
2.5x
A site that loads in 1 second converts at roughly 2.5× the rate of one loading in 5 seconds.
Source: Adobe
75%
of B2B organisations will complete their highest-revenue deals through digital channels by 2028.
Source: Gartner, Magic Quadrant for Digital Commerce, Nov 2025
75% +
of aftermarket executives expect heightened M&A, with eCommerce capability a top-three priority.
Source: McKinsey, Automotive Aftermarket M&A and Value Creation
Five Layers. Eight Leak Points.
One Compounding Problem.
Each layer is independent but compounds the others. Strong search with a broken checkout loses the demand it captures. A perfect checkout with no retention loses the customers it converts.
Layer
Demand Capture Are you visible to customers already looking? Search, navigation, and fitment SEO decide whether they find you – or your competitor. Increasingly, whether AI assistants surface you at all.
Layer
Conversion Engine Traffic without conversion is just cost. Product content, fitment confidence, and checkout performance decide whether a visitor becomes a buyer.
Layer
Revenue Per Order Every transaction can do more. Bundling, upsell, and the right recommendation at the right moment decide how much each order is actually worth.
Layer
Operational Reliability Slow pages, inaccurate stock, and delayed fulfilment lose revenue silently. No complaints, no visibility, no obvious owner.
Layer
Customer Lifetime Value
The first sale is the least profitable. Repeat-purchase mechanics, retention, and post-sale support decide whether a customer was worth acquiring at all.
Eight Specific Leak Points,
Mapped to the Layer They Sit in.
| Leak | What it looks like | Why it's expensive |
|---|---|---|
| Catalog & fitment dataLayer 1 + 2 |
High Wrong part recommended, vehicle lookup fails or returns nothing |
Lost order + return cost + damaged trust, repeated across thousands of daily transactions |
| Platform performanceLayer 2 |
High Pages loading 15+ seconds, checkout friction |
Every second above 3 is a measurable abandonment event |
| Systems fragmentation Layer 4 |
Medium Inconsistent branch pricing, stock shown as available when it isn't |
Margin bleed that runs in the background after every unintegrated acquisition |
| Fulfilment Layer 4 |
High
Orders placed but delayed or unfilled |
Worse than a lost sale: a return, a complaint, and a reason to switch suppliers |
| B2B orderingLayer 2 + 3 |
Medium Trade portals that are slow, incomplete, or need a phone call |
Every friction point is a defection risk in the next reorder cycle |
| Customer dataLayer 5 |
High No single view of a customer across branches |
The most expensive leak, because lost customers rarely announce themselves |
| Technical contentLayer 2 |
Medium No install guides or fitment confirmation for ADAS, EV, MHEV parts |
Workshops won't buy what they can't verify, suppressing the highest-margin SKUs |
| AI discoverabilityLayer 1 |
High Catalog data not structured for AI retrieval |
Invisible when ChatGPT, Gemini, or Perplexity answer "where do I buy this part" |
Most of this stays invisible until it's benchmarked against all eight at once. Pricing errors get written off as one-offs. Slow pages get blamed on "the internet." Acquisition integration gets deprioritised because it isn't customer-facing. None of it adds up, because nobody owns the total.
We Fixed This Exact Problem
for a Leading UK Car Parts Retailer.
They were running on a platform that couldn’t keep up with order volume or buyer expectations. We rebuilt the foundation: a composable Adobe Commerce architecture, real-time catalog sync, and fitment logic that matches parts to vehicles instead of relying on static tables.
16h →17min
Catalog export
15s → 3–4s
Checkout speed
2.16% → 0.73%
Zero-result searches
+27%
Unique searches
£65 → £102+
Fitment-bundle AOV
4×/day → 6×/day
Stock refresh
We’ve since run the same playbook with a second leading UK car parts retailer, with comparable results in checkout speed, average order value, and search accuracy. This isn’t a one-off. It’s a repeatable methodology applied to a sector we know in detail: vehicle-specific fitment, trade-account behaviour, branch-level inventory, and the margin structure of high-volume, low-AOV parts businesses.
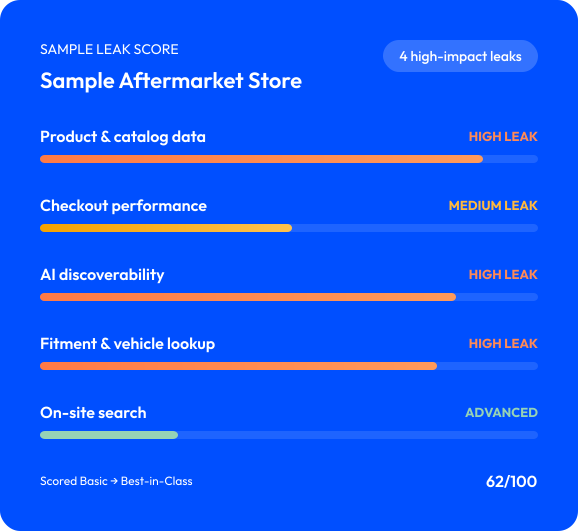
A Scored Report, Not a Sales Call.
Every leak point rated for maturity and revenue impact, benchmarked against our UK aftermarket engagements, with the one fix we’d start on.

01. A maturity score for each area.
Basic → Developing → Advanced → Best-in-Class, across all eight leak points.
02. A revenue-impact rating.
High / Medium / Low for every leak, so you fix in the order that pays back first.
03. A side-by-side benchmark.
Your scores against our UK aftermarket case-study results.
04. One prioritised recommendation.
The single fix we'd start on, and why.
See Exactly Where Your Store is Leaking Revenue.
A non-intrusive assessment of your live site against the same eight leak categories used in our UK aftermarket engagements. No pitch deck. No account manager on the first call. Just the assessment, the numbers, and what we’d fix first.
- Maturity + revenue-impact score for all eight leaks
- Benchmarked against real aftermarket results
- One prioritised fix to start on
Two fields. That's the whole form.
